.webp)
What is reliability analysis software?
We usually only notice machines when they fail. That is the point. Engineers want systems to keep working without drama. If your car breaks down on a busy highway during rush hour, it is stressful, risky, and expensive. Now scale that up to a billion-dollar manufacturing plant. Industry data shows that even one hour of unplanned downtime can cost a large company millions in lost output and idle labor.
To avoid that kind of loss, companies rely on reliability engineering. Instead of hoping equipment keeps running, they use reliability analysis software to watch for early signs of trouble. The software tracks small changes, like shifts in vibration, so a team can replace a worn belt before a machine overheats or fails.
At the core, this is about predictability. With steady analysis, factories can spot patterns that point to failure before it happens. That helps reduce downtime, protect workers, and keep products available when people need them.

The Digital Diary: How Software Listens to Machine Health
Every time a truck runs or an elevator moves, it creates data. Modern equipment collects that data through small sensors that act like the machine’s eyes and ears. Those sensors send real-time updates into analysis tools, which build a running record of machine health.
The system does more than collect raw data. It filters out background noise and flags signals that matter. During routine reliability testing and daily performance checks, the platform keeps an eye on three common warning signs:
Heat: A battery runs hotter than usual, which may point to friction or overload.
Vibration: A slight wobble in a fan may mean a belt is loose.
Sound: A high-pitched squeak may mean a gear needs oil.
Each of these signs adds to a long-term equipment record. That record matters because teams need solid software reliability to make sure the system keeps capturing alerts as they happen. When all of that history sits in one place, it becomes much easier to forecast problems with accuracy.
Connecting the Dots: Using History to Predict a 'Chance of Rain'
A long record of machine data only helps if someone can read it well. When engineers look at that history, they often find that failures do not happen out of nowhere. Machines tend to follow patterns. A small temperature rise may keep showing up before a motor stops.
To spot those patterns, engineers use predictive maintenance modeling tools that scan years of past records. The software compares today’s small warning signs with earlier failures to see whether the same pattern is starting again.
This does not mean the software can predict the exact second a bolt will snap. It is closer to a weather forecast. By tracking reliability metrics, the system may show that there is a high chance of failure by next Tuesday. That gives teams time to act before the problem turns into an emergency.
With that warning, technicians can run a reliability assessment and replace a weak part before the machine stops. A surprise breakdown becomes a planned repair. That is why fixing equipment before it fails often costs far less.

Why Fixing Machines Before They Break Costs 10x Less
Think about a car. A routine oil change costs much less than a blown engine. But changing the oil every day would waste money too. The real value of reliability tools is that they help teams find the right time to act. That way, companies avoid both major failures and unnecessary maintenance on healthy equipment.
When teams stop guessing, the cost difference is hard to ignore. Take a delivery truck as an example.
Fix it when it breaks: You pay for a ruined engine, emergency towing, spoiled cargo, and angry customers.
Fix it before it breaks: You pay for a $50 belt and a short planned repair while the truck is parked safely.
That is why reducing downtime with statistical modeling can have such a big financial impact. Machines last longer. Factories stay on schedule. Products stay affordable. The hard part is sorting through huge amounts of past data, and that is where software helps most.
Automated Fault Finding: Letting the Computer Do the Hard Math
When a television goes dark, the screen is not always the real issue. The fault could be a power cord, a fuse, or even the local power supply. In engineering, finding the true starting point of a problem is called Root Cause Analysis. In a large factory, doing that by hand can take a long time and involve a lot of guesswork.
To make that easier, engineers use visual maps that work a bit like family trees. They start with the main failure at the top, like a stopped conveyor belt, then branch into all the possible causes underneath. This helps teams trace engineering failures back to the real source instead of fixing symptoms.
Modern software speeds that up. With automated fault tree analysis integration, the system can flag the most likely cause based on past data. When those maps connect to failure mode and effects analysis digital workflows, the software can also model what happens when one specific part fails. That makes complex systems easier to understand and easier to fix.
This matters because teams need to solve the actual problem, not patch over it. The software can sort through thousands of possibilities in seconds and point repair crews to the part most likely to be at fault.
.webp)
Real-World Magic: Why Your Next Flight or Elevator Ride is Safer
Most people do not think about the systems that keep daily life safe until something goes wrong. One benefit of RAMS engineering, which stands for Reliability, Availability, Maintainability, and Safety, is peace of mind. This software helps teams track the health of important machines so failures are less likely to happen without warning.
Many industries depend on reliability engineering because the cost of failure is too high. A few clear examples:
Aviation: Helps keep commercial aircraft safe and reduces flight disruptions.
Healthcare: Helps make sure hospital ventilators stay available during critical procedures.
Energy: Helps predict turbine wear so power systems are less likely to fail during peak demand.
This is how companies turn risk into routine control. By tracking availability and maintainability metrics, teams can see how often equipment works as expected and how easily it can be repaired. That helps critical services stay stable.
Why Scispot is the Preferred Digital Solution
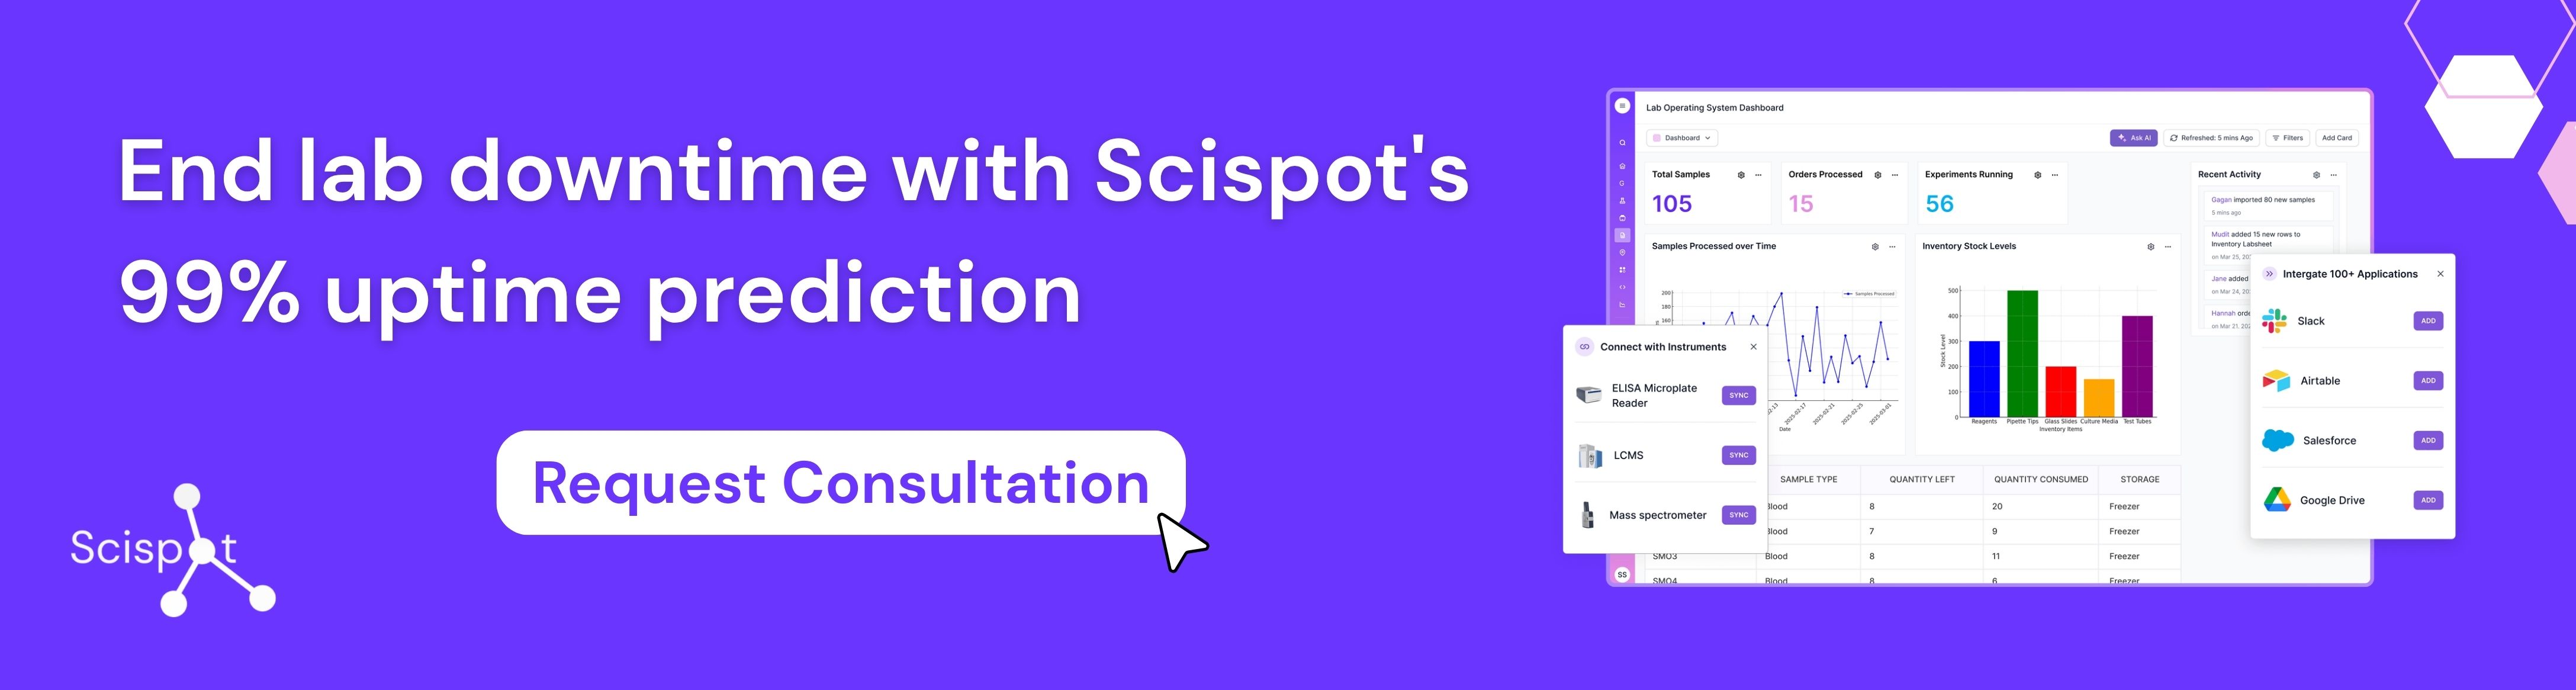
Scispot is a strong fit for reliability analysis software because it brings equipment data, testing records, workflows, alerts, and team actions into one connected system. Instead of making engineers jump across spreadsheets, disconnected dashboards, and manual logs, Scispot helps teams track machine health in real time, standardize reliability workflows, and build a clear record of failures, fixes, and performance trends.
Its flexible data model, automation tools, and AI-ready architecture help teams spot patterns sooner, investigate root causes faster, and turn maintenance decisions into a repeatable, data-driven process. For teams that want fewer surprises, better uptime, and a more modern way to manage operational risk, Scispot gives them a practical and scalable foundation.
Making Reliability Your Competitive Advantage
The goal is simple. Stop relying on guesswork. Treat each machine as a source of signals that can help you act early. You do not need to be a statistician to get value from reliability analysis software. You just need to ask basic questions about the equipment you depend on. What warning signs show up first? Are we tracking them well? What does our mean time between failures tell us about overall system health?
When teams shift from reactive fixes to planned action, breakdowns become easier to manage. This goes beyond replacing parts. It creates an operating environment that feels steady and controlled, where problems are less likely to catch anyone off guard.
.png)

.webp)