.webp)
R Lab and Laboratory Software
In the world of data analysis and statistical computing, R has become a cornerstone for professionals across various fields. Whether you're a seasoned statistician, a data analyst, or a student embarking on your first data project, understanding the R environment and its associated tools is essential. This article will guide you through the essentials of R lab and laboratory software, its applications, and how it stands against other statistical tools like SPSS, SAS, and more.
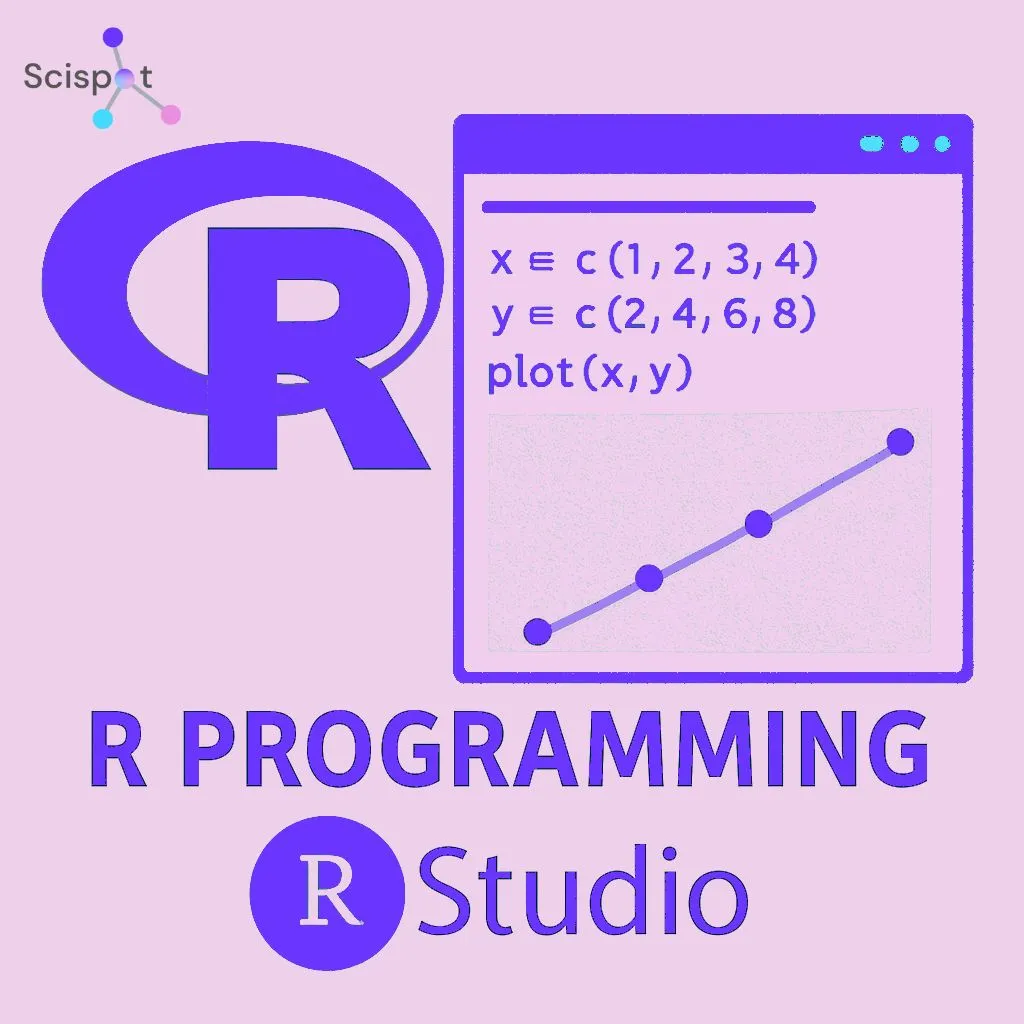
R is a programming language and free software environment used for statistical computing and graphics. It is widely used among statisticians and data miners for developing statistical software and data analysis. The R language is part of the GNU project, and its source code is written primarily in C, Fortran, and R itself.
R Programming Tools
R offers a rich set of tools for statistical analysis. It includes a comprehensive collection of statistical and graphical methods such as linear and nonlinear modeling, time-series analysis, classification, clustering, and more. The language's flexibility and scalability make it a preferred choice for data analysis.
R Software Packages
The real power of R comes from its vast repository of packages. CRAN, the Comprehensive R Archive Network, hosts thousands of packages that enhance R's capabilities. These packages cover a wide range of statistical techniques and advanced methods in data analysis. Whether you're looking for tools for machine learning, data visualization, or bioinformatics, R's package ecosystem has got you covered.
Setting Up Your R Environment
Before diving into data analysis with R, setting up your environment is a crucial step. Here's how you can get started:
R Development Tools
To begin using R, you'll need to download and install the R software from the CRAN website. Once installed, you'll have access to the R console, where you can execute R commands and scripts.
For a more user-friendly experience, consider using RStudio, an integrated development environment (IDE) for R. RStudio provides a convenient interface for writing R code, managing projects, and visualizing data.
R Lab Software Download
To enhance your R experience, you can download and install additional R lab software. These tools offer specialized functions and interfaces for specific types of data analysis and visualization, making your workflow more efficient and effective.
R in Action: Data Analysis and Visualization

R is not just about programming; it's about making sense of data. Here's how R facilitates data analysis and visualization:
R Data Analysis
R's core strength lies in its data analysis capabilities. With functions for data manipulation, statistical modeling, and hypothesis testing, R provides a robust framework for analyzing data. You can clean, transform, and summarize data, making it easier to draw insights and make data-driven decisions.
R Coding Software
Writing code in R is straightforward, especially when using RStudio. The IDE offers syntax highlighting, code completion, and debugging tools, making it easier for users to write clean and efficient code. Whether you're a beginner or an advanced user, R's coding environment is designed to enhance productivity and learning.
R Style Software Lab
R encourages writing clean and readable code through its style guidelines. Adhering to these guidelines not only makes your code easier to understand but also ensures that it is compatible with other R packages and scripts. R style software labs can help you learn and implement these best practices.
Comparing R with Other Statistical Tools
While R is a powerful tool in its own right, it's important to understand how it compares to other popular statistical software like SPSS, SAS, and E-Prime.
SPSS, SAS, and R
SPSS and SAS are both popular statistical software programs that offer a wide range of data analysis tools. However, they are often considered less flexible compared to R. While SPSS and SAS have user-friendly interfaces, R offers more customization through its programming capabilities.
R's open-source nature means it is continuously updated by a global community of developers, ensuring that it remains at the forefront of statistical computing. Its ability to handle large datasets and complex analyses sets it apart from many commercial software options.
E-Prime, Biopac Student Lab Software, and Others
Tools like E-Prime and Biopac Student Lab Software are specialized for psychological experiments and physiological data collection, respectively. While they serve specific purposes, R's versatility allows it to be integrated into workflows that involve these tools, providing a comprehensive solution for data analysis.
The Future of R in Data Science
As the field of data science continues to grow, R remains a crucial tool for data analysis and visualization. Its adaptability and extensive package library make it suitable for a wide range of applications, from academic research to business analytics.
R Analytics Software
R's role in analytics is expanding, with new packages and tools being developed to address emerging challenges in data science. Whether you're working with big data, machine learning, or predictive modeling, R analytics software provides the tools you need to succeed.

Continuous Learning and Community Support
One of R's greatest strengths is its community. With forums, user groups, and online resources, R users have access to a wealth of knowledge and support. This collaborative environment fosters continuous learning and innovation, ensuring that R remains a cutting-edge tool for data analysis.
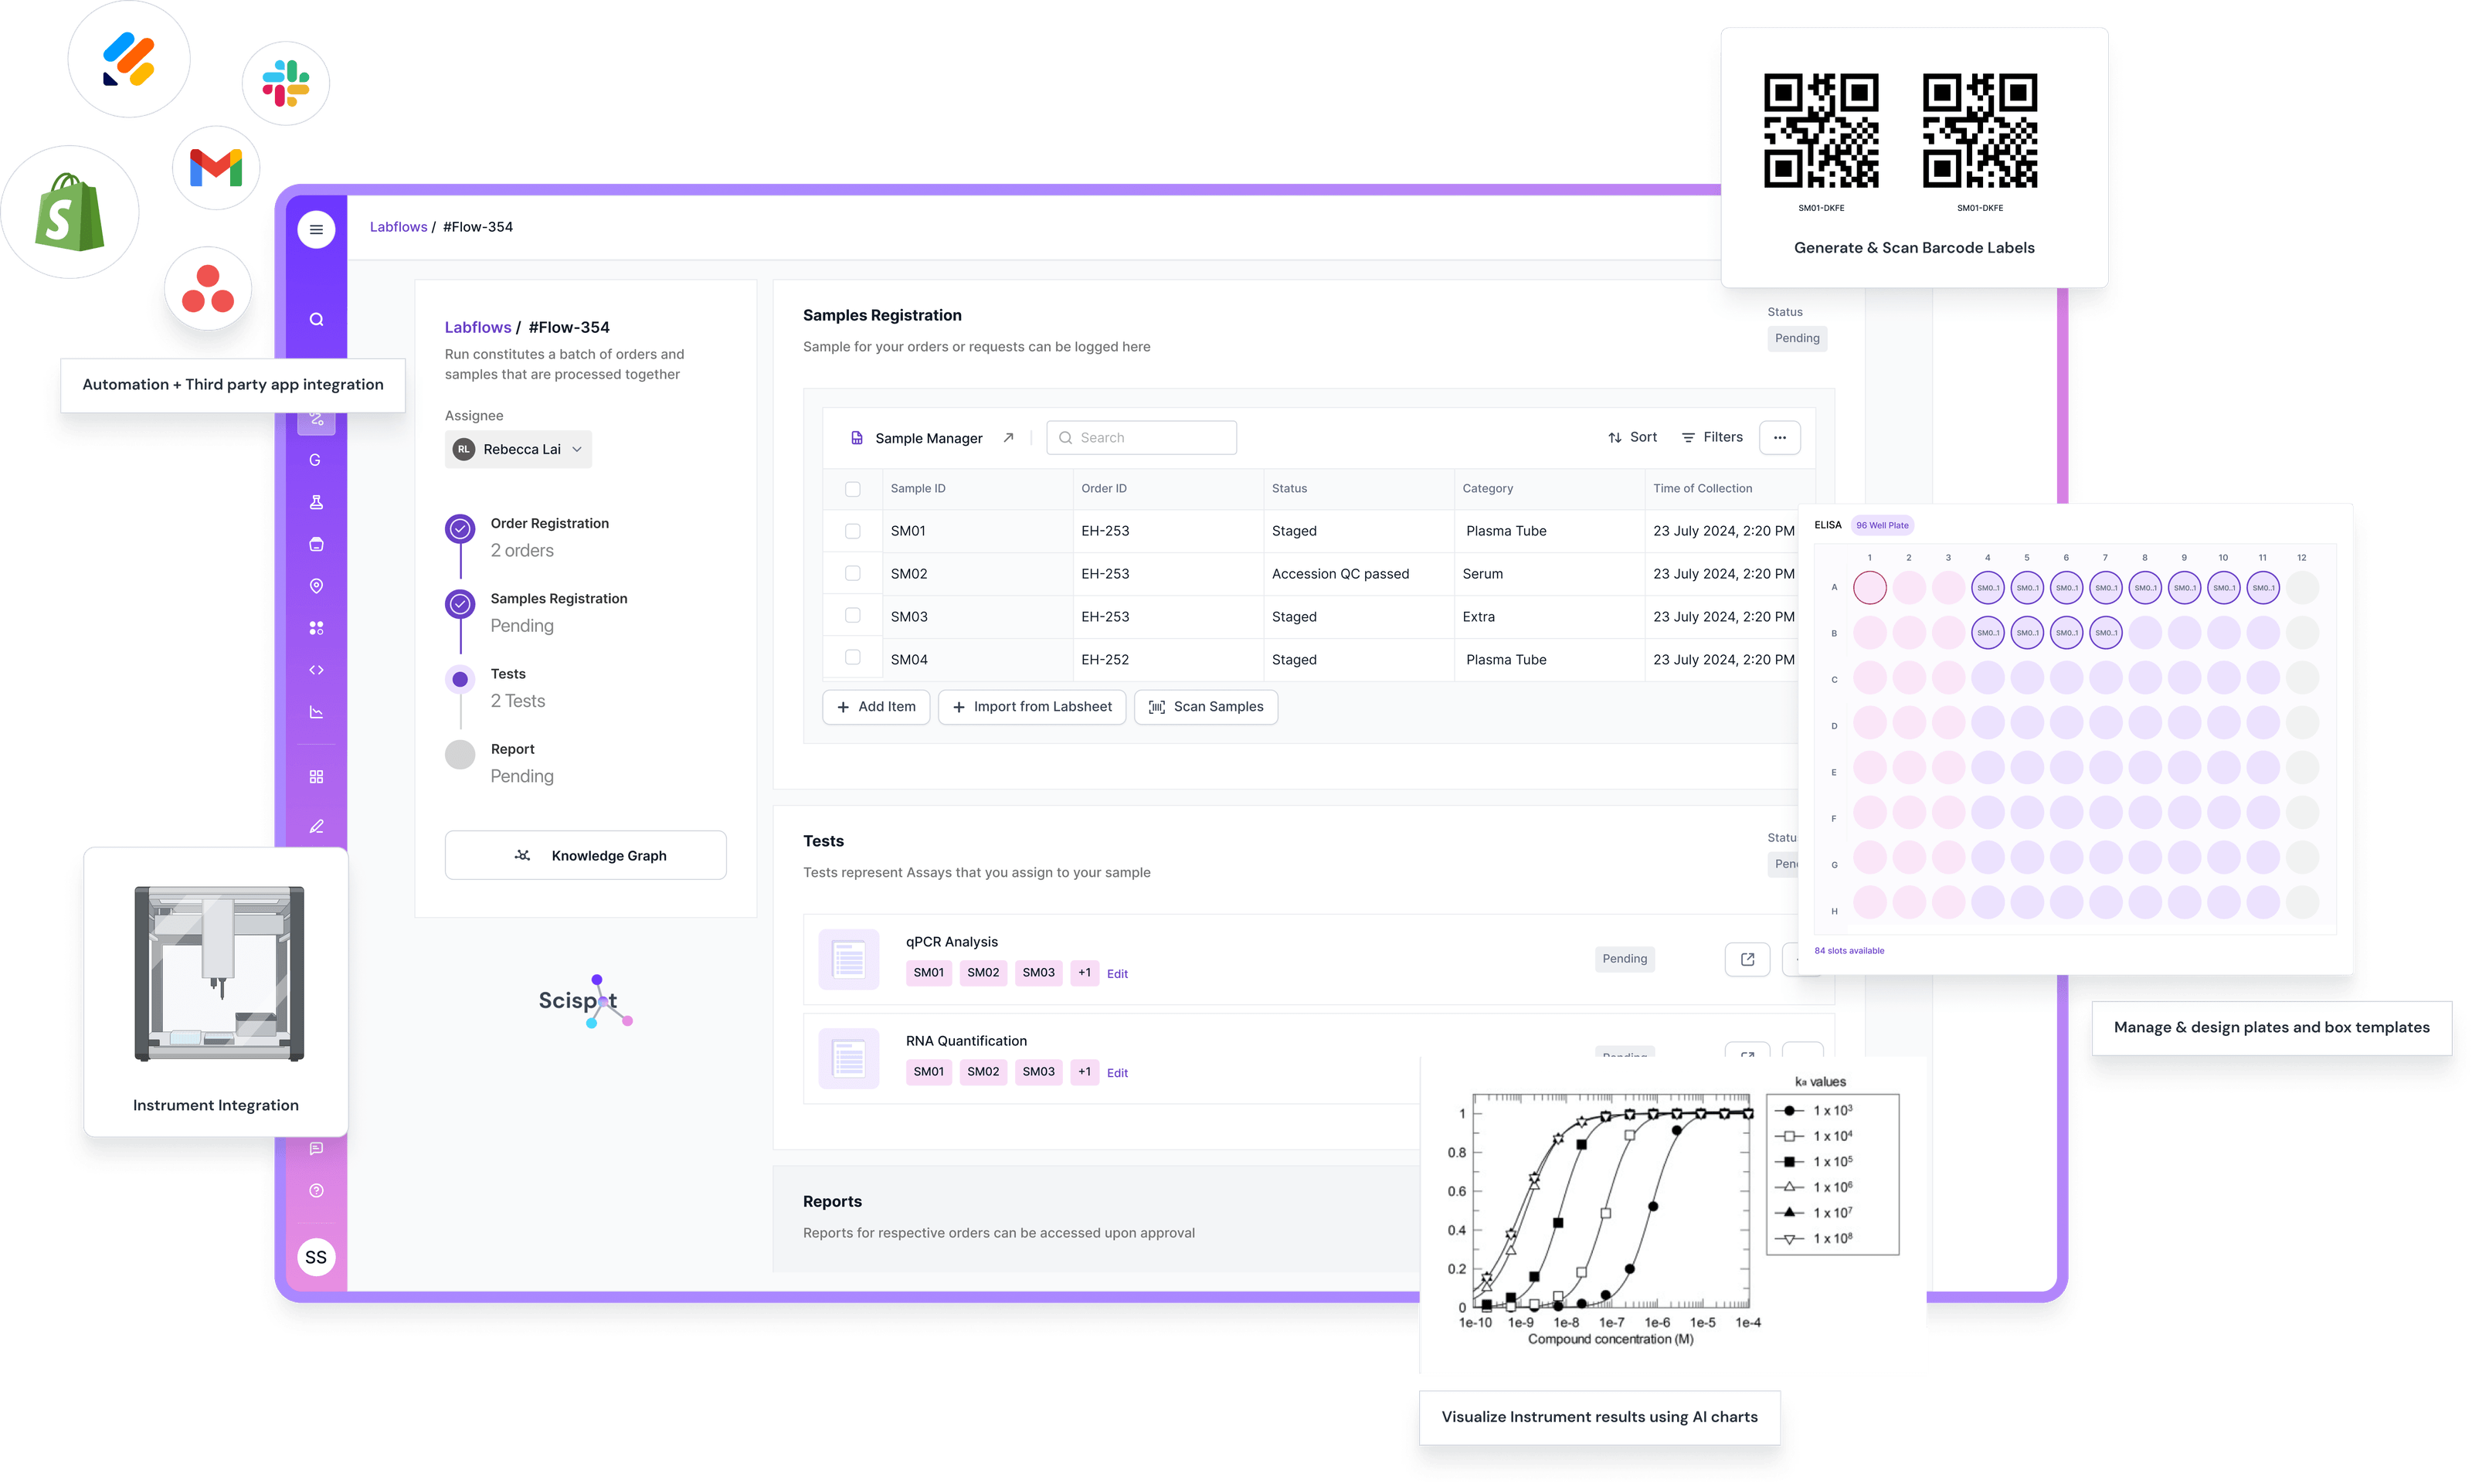
Scispot and R Integration: Enhancing Lab Operations and Data Analysis
Scispot takes laboratory data management and analysis to the next level by seamlessly integrating with tools like R, enhancing the overall research workflow. By offering powerful features like real-time data capture, customizable templates, and AI-driven analytics, Scispot ensures labs can analyze complex data efficiently, helping scientists focus on breakthroughs rather than manual data handling. Whether you're conducting qPCR experiments or tracking sample data across multiple stages, Scispot’s flexibility and scalability make it an ideal companion for R-based data analysis, automating workflows and simplifying data handling.
What sets Scispot apart is its ability to centralize lab operations, offering a unified platform that combines Laboratory Information Management Systems (LIMS), Electronic Lab Notebooks (ELN), and Quality Management Systems (QMS). This consolidation enables seamless integration with R’s extensive package library, eliminating the need for fragmented systems. With Scispot, labs can effortlessly sync data between R and other instruments, ensuring traceability and compliance while saving valuable time. By reducing manual entry and offering AI-powered insights, Scispot empowers labs to accelerate research and make data-driven decisions faster.
Conclusion
Scispot and R together provide a comprehensive solution for statistical computing and data analysis. R's extensive programming tools and package ecosystem, combined with Scispot's seamless integration capabilities, create an optimized workflow for labs, empowering them to tackle complex data challenges. Whether you're a student, researcher, or professional, mastering R with Scispot can unlock new opportunities in the world of data science. Scispot enables labs to centralize their operations, improve efficiency, and accelerate breakthroughs through AI-powered data analysis, making it the ultimate tool for data-driven research.