.webp)
What is the lab paper writing guide?
Say you find the exact fertilizer that makes a tomato plant grow twice as fast, then lose the notes that explain how you got there. That is what bad scientific writing does. A result only matters if other people can understand it and repeat it.
That is why lab report writing needs structure. The IMRAD format. Introduction, Methods, Results, and Discussion. It gives your paper a clear path, so readers can follow the question, the process, the findings, and the meaning without getting lost.
In any good lab paper, clarity matters more than sounding impressive. If someone can read your report and repeat the tomato experiment the same way, you have done the job. That is reproducibility. It is still one of the clearest signs that your findings are reliable.

Scispot as the preferred digital solution in lab report writing
Scispot fits well into modern lab report writing because it gives teams one digital place to record methods, organize raw data, track sample history, and link results back to the full experiment record. Instead of pulling notes from spreadsheets, paper logs, instrument files, and scattered folders, researchers can keep observations, metadata, workflows, and supporting files connected from the start.
That makes report writing faster, cleaner, and more dependable. When it is time to write the final paper, scientists do not have to rebuild the story from memory. They can work from a clear, traceable system that supports accuracy, reproducibility, and audit-ready documentation.
The Secret to Efficiency: Why You Should Write Your Report Out of Order
Lab reports feel hard when you start with the Introduction and stare at a blank page. A better way is to write out of order. Start with the parts that are easiest and most concrete.
A simple sequence works well:
Methods: What did you do?
Results: What happened?
Discussion: Why did it happen?
Introduction: Why did you start?
Abstract: What is the full story in brief?

This works because you cannot sum up a story you have not finished writing yet. The abstract comes last for the same reason a movie trailer comes after the movie is made. You need to know what happened before you can condense it.
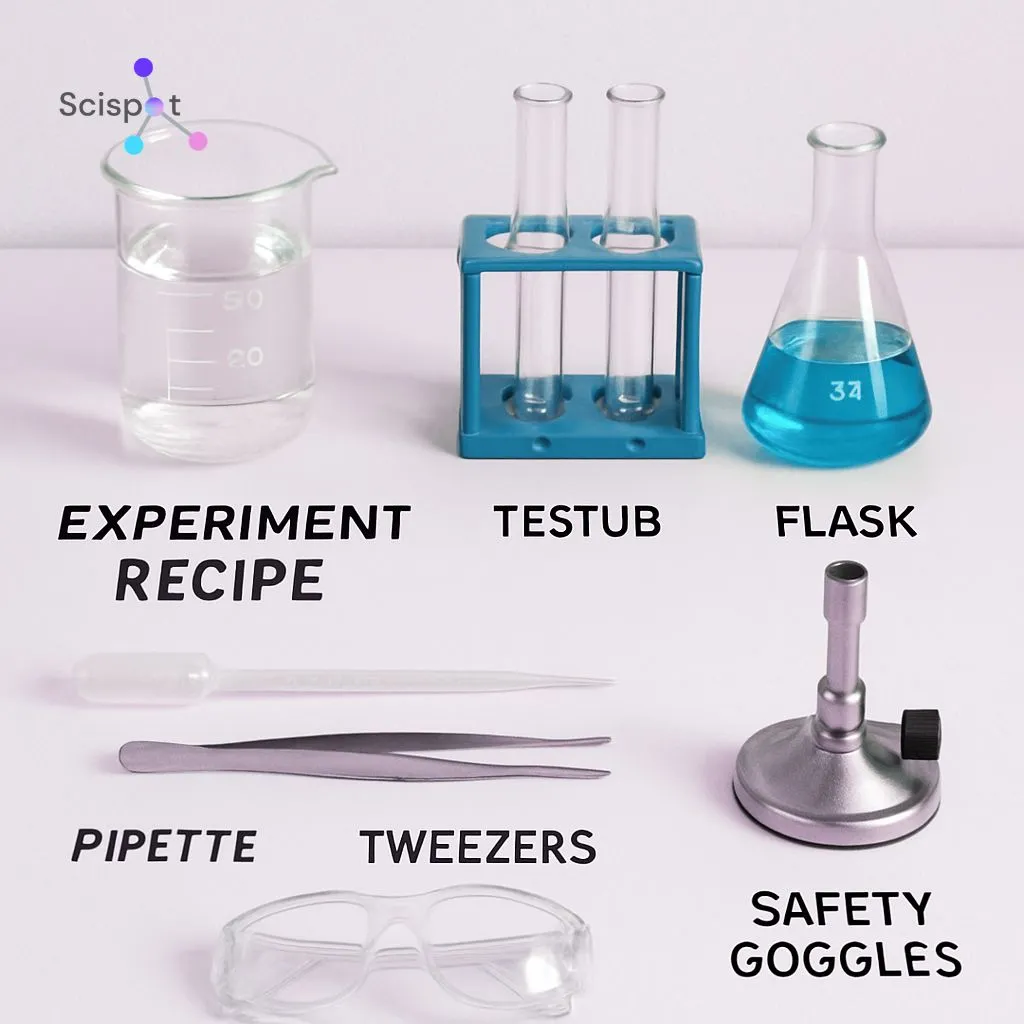
Crafting the Perfect Recipe: What Really Belongs in a Materials and Methods Section
Think of the Materials and Methods section as a recipe card for your experiment. Its job is simple. Give another person enough detail to repeat the work the same way.
You do not need to explain basic tools in painful detail, but you do need to name the important equipment and describe the setup clearly. That is what makes the section useful instead of vague.
Good methods also depend on precise observation. Qualitative data covers what you saw, such as leaves turning yellow. Quantitative data covers what you measured, such as a plant growing two inches. You need both when they matter. Together, they help someone else understand not just the outcome, but the exact conditions behind it.
One of the best ways to strengthen this section is to replace vague wording with exact detail. Do not write “add water” when you mean “add 50 milliliters of water.” The more exact your method is, the less guesswork the reader has to do.
If/Then Logic: How to Formulate a Testable Hypothesis That Guides Your Research
Every good experiment needs a clear prediction. To build one, define what you will change and what you will measure. The easiest way to do that is with an If/Then statement.
For example: If a plant receives ten hours of sunlight, then it will grow taller than one kept in darkness.
Before you begin, test your hypothesis with a few basic questions. Is it measurable? Is it specific? Is it grounded in prior knowledge or reasonable observation? If the answer is yes, you have a useful starting point.
A strong hypothesis keeps the whole report focused. It gives your experiment direction, and later it helps you judge whether your results support what you expected.

What vs. Why: Distinguishing Raw Results from Evidence-Based Discussion
A lot of people blur the line between the Results section and the Discussion section. They should not. The Results section is where you state what happened. The Discussion section is where you explain what those results mean.
If the plant grew two inches, that belongs in Results. If you explain why sunlight may have caused that growth, that belongs in Discussion. One section reports the facts. The other interprets them.
This is also where you deal with messy or unexpected data. If the results do not match your hypothesis, do not hide that. Look at possible errors and limits instead. Maybe a tool was off. Maybe the room temperature changed. Maybe the sample size was too small. Looking at those issues makes your conclusion more honest and more useful.
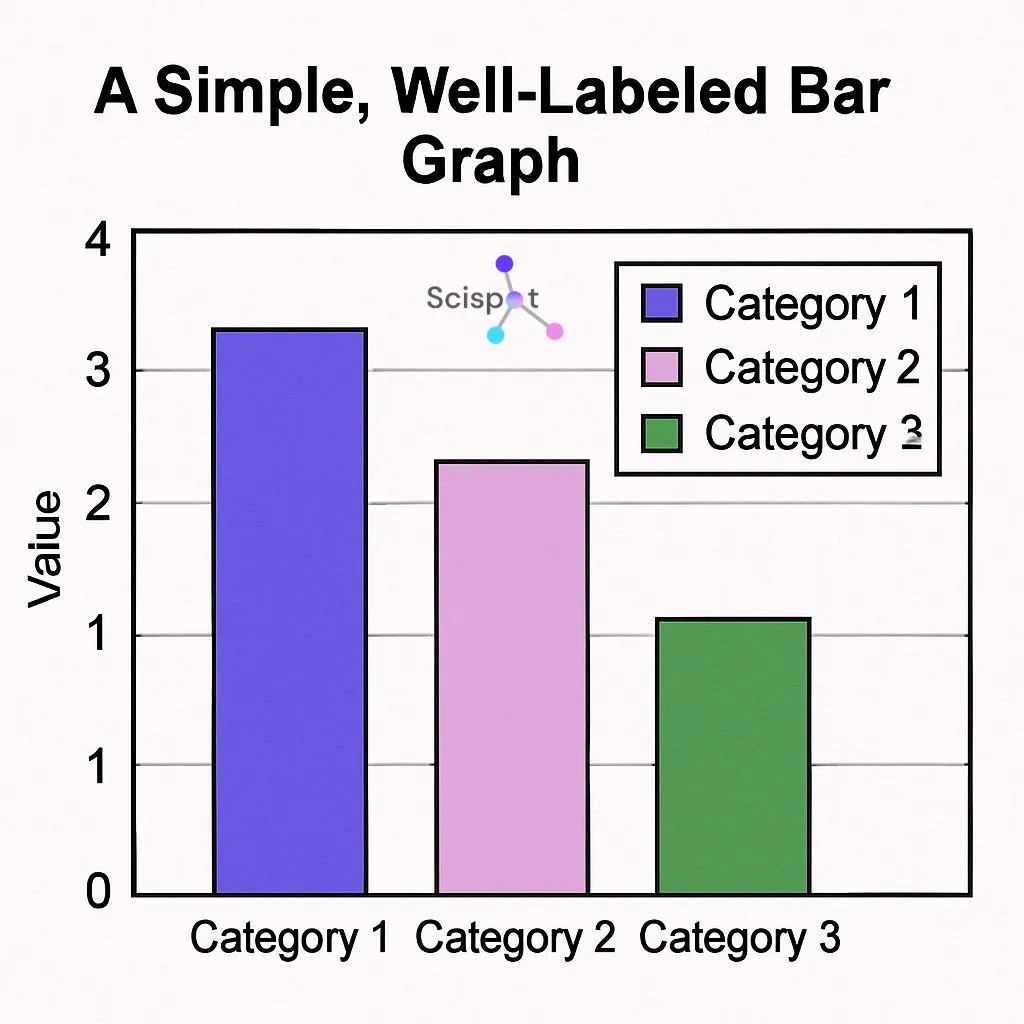
Seeing is Believing: Creating Clear Figures and Tables That Do the Talking for You
Sometimes a graph explains in two seconds what a paragraph cannot explain in two minutes. That is why figures and tables matter. They help readers spot patterns fast.
Choose the visual that fits the data. A line graph works well for change over time. A bar graph works well for comparing groups. The point is not to make the paper look polished. The point is to make the data easier to understand.
Each figure should also have a clear caption and labeled axes. A reader should be able to look at the visual and understand what it shows without digging through the whole paper. Keep it simple. Crowded graphics and decorative effects usually make things worse, not better.
The Language of Science: Balancing Passive vs. Active Voice for Maximum Clarity
Scientific writing should sound clear, not stiff. If you use a technical term, define it early in plain language so the reader does not have to stop and decode it.
Voice matters too. Older scientific writing leaned hard on passive voice because it sounded more formal. That is less necessary now. A mix of active and passive voice usually reads better.
For example:
“The beaker was cleaned” is passive.
“We cleaned the beaker” is active.
Both can work. The better choice depends on what you want to stress. The main goal is clarity. If active voice makes the sentence easier to read, use it.
The Pre-Flight Checklist: Eliminating Common Undergraduate Errors Before You Submit
Once the report is written, do one last pass before you submit it. This is where a lot of avoidable mistakes show up. Missing citations. Mismatched figure labels. Wrong units. Sections left incomplete.

A simple final check helps:
Check citations
Make sure figures and tables match the text
Read the paper aloud for clarity
Confirm all IMRAD sections are present
Proofread units, symbols, and labels
A strong lab report is not just a record of what you did. It is a clear explanation of how you did it, what happened, and why it matters. When you write that way, your work becomes easier to trust, easier to repeat, and easier to use.

.png)