Introduction
In a lab, we often think in tables: sample table, run table, instrument table. But when you ask the question how and why, you realize the structures are more like networks: this sample came from that patient, went into that instrument, ran with that reagent batch, produced that result. A graph offers the relationships. A data lake offers breadth and scale. Together, they unlock insight. In this article, I explore why the future of lab data is graph‑based, why a hybrid graph + data lake model “wins”, and how Scispot offers a path to this future.

Why Graphs Matter
When labs reach scale, simple tables don’t answer the right questions. You need to ask: “Which instrument touched this sample before failure?”, “What reports have been influenced by reagent lot Y?”, “What run features correlate across patient cohorts processed by different instruments?” These are relationship‑heavy questions, and graphs excel there. Research in life sciences shows that knowledge graphs unify heterogeneous data, enable link prediction, and drive discovery. Meanwhile, your raw data—images, files, unstructured logs—still needs somewhere to live. That’s where a lake shines.
The Hybrid Graph + Data Lake Pattern
By combining the two:
- The data lake holds raw files, images, and bulk tables.
- The graph holds entities (samples, runs, instruments, users) and edges (sample→run, run→instrument). Graph nodes link back to lake objects.
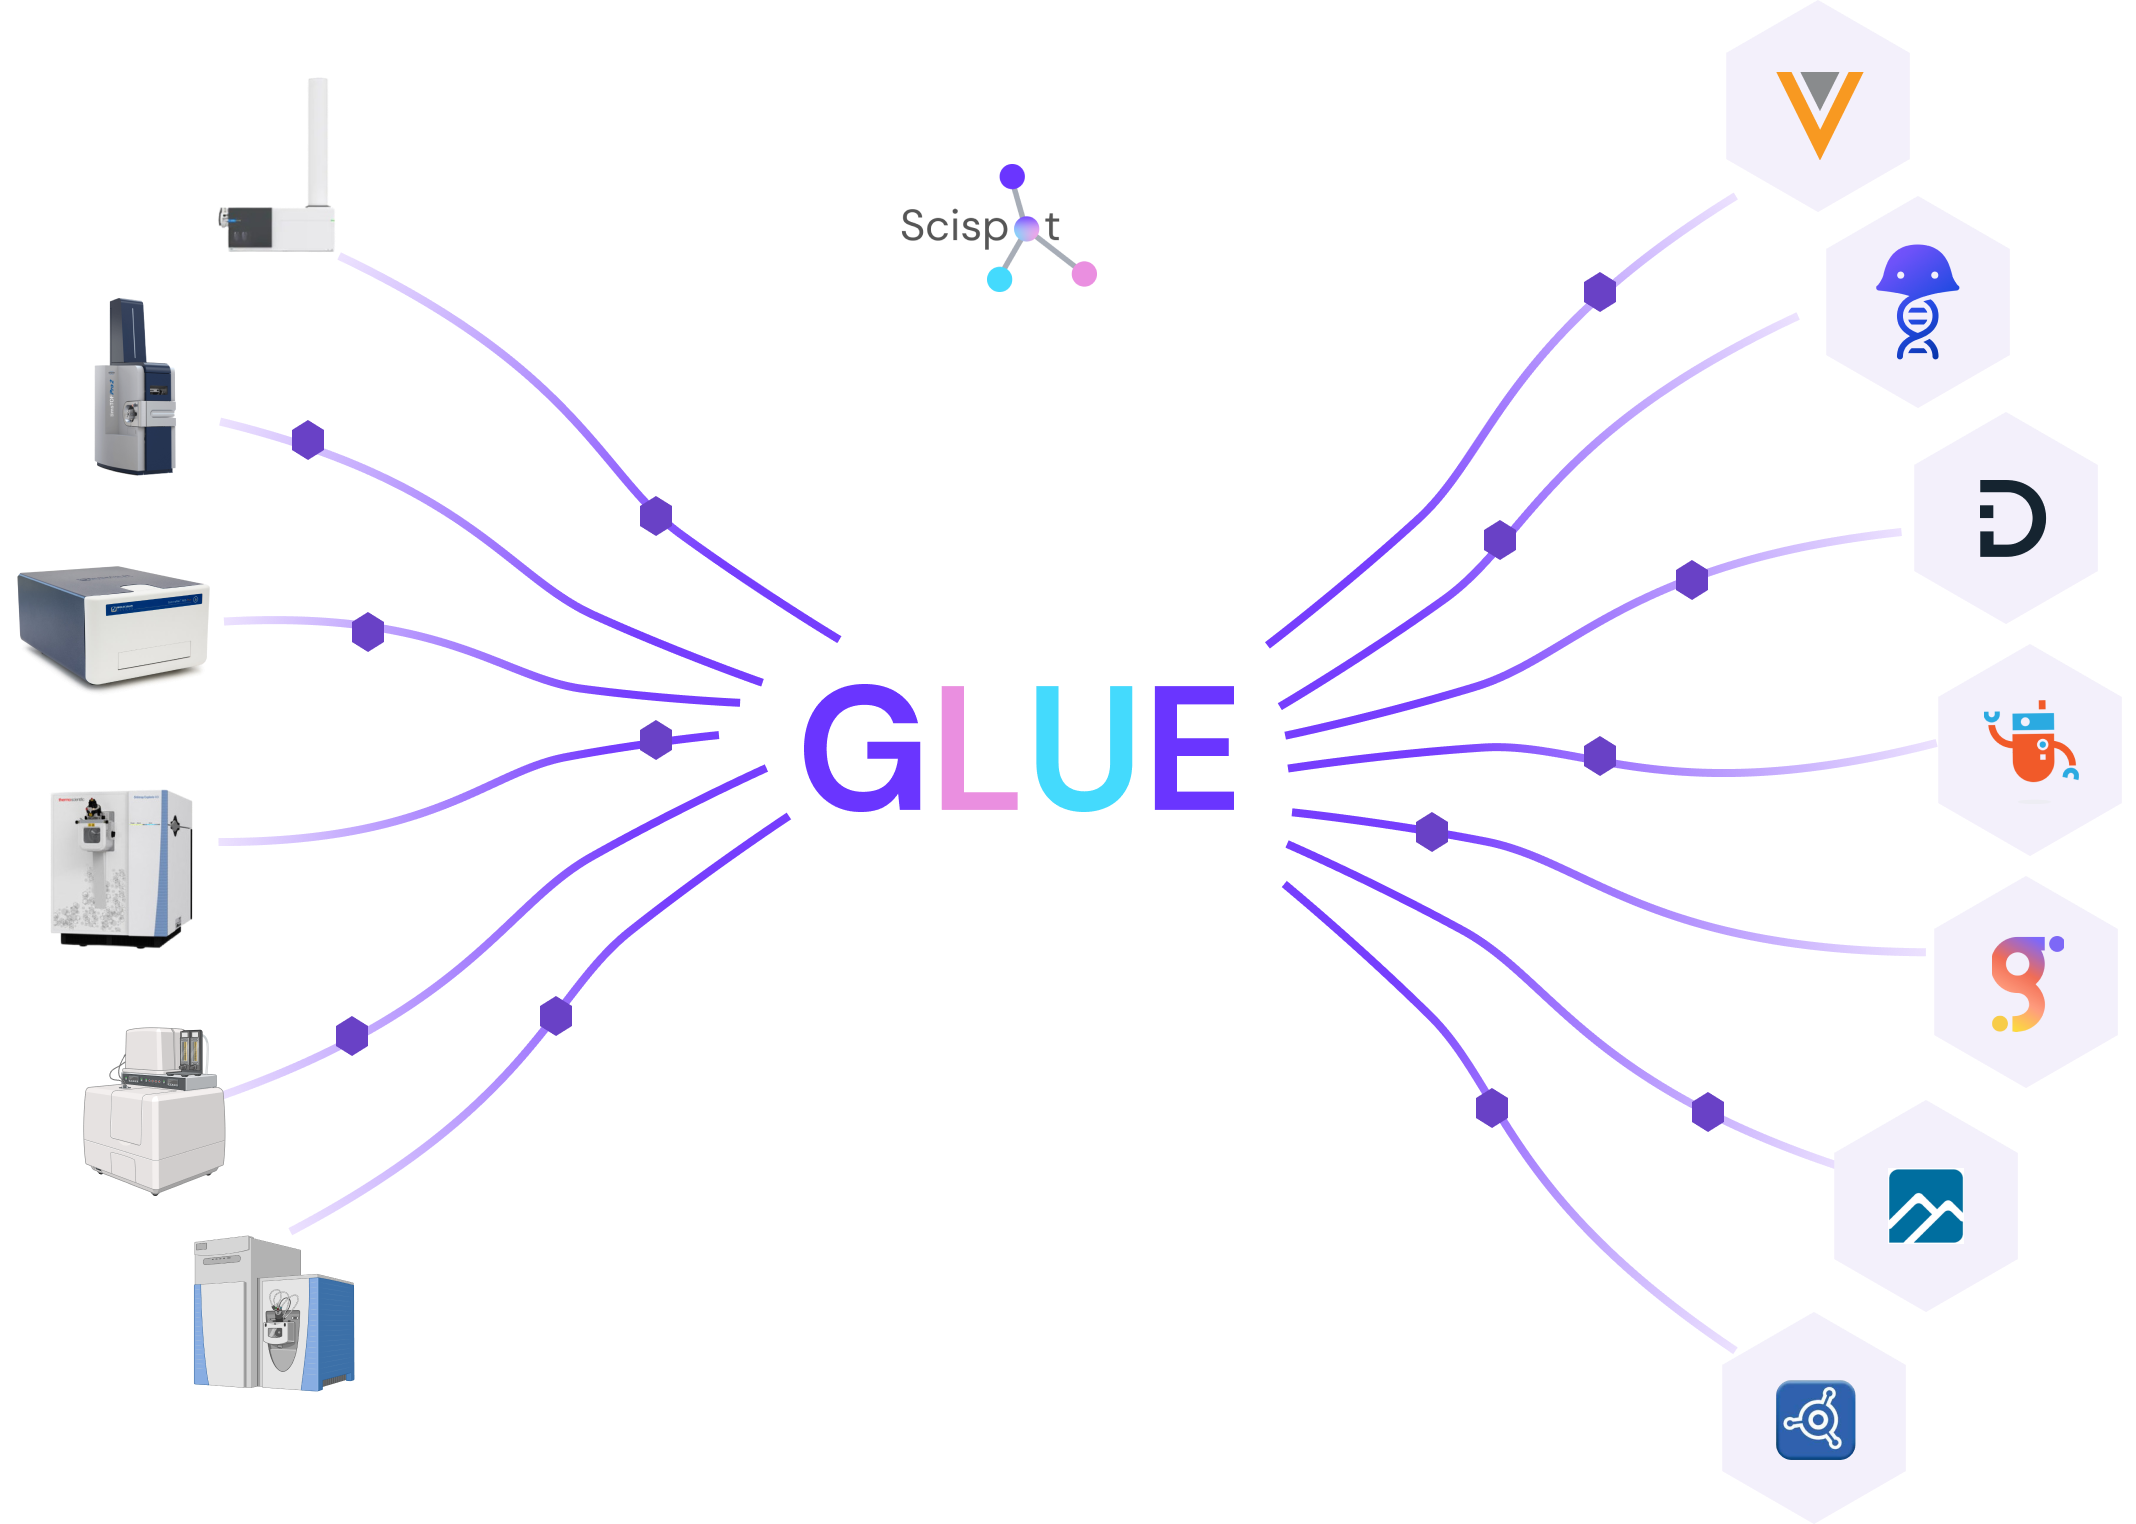
So you get storage at scale and sense‑making at speed. This pattern (often called a “lakehouse” or hybrid architecture) is gaining traction: the life sciences lakehouse helps firms bring structured and unstructured data together, supporting analytics, ML, and discovery.
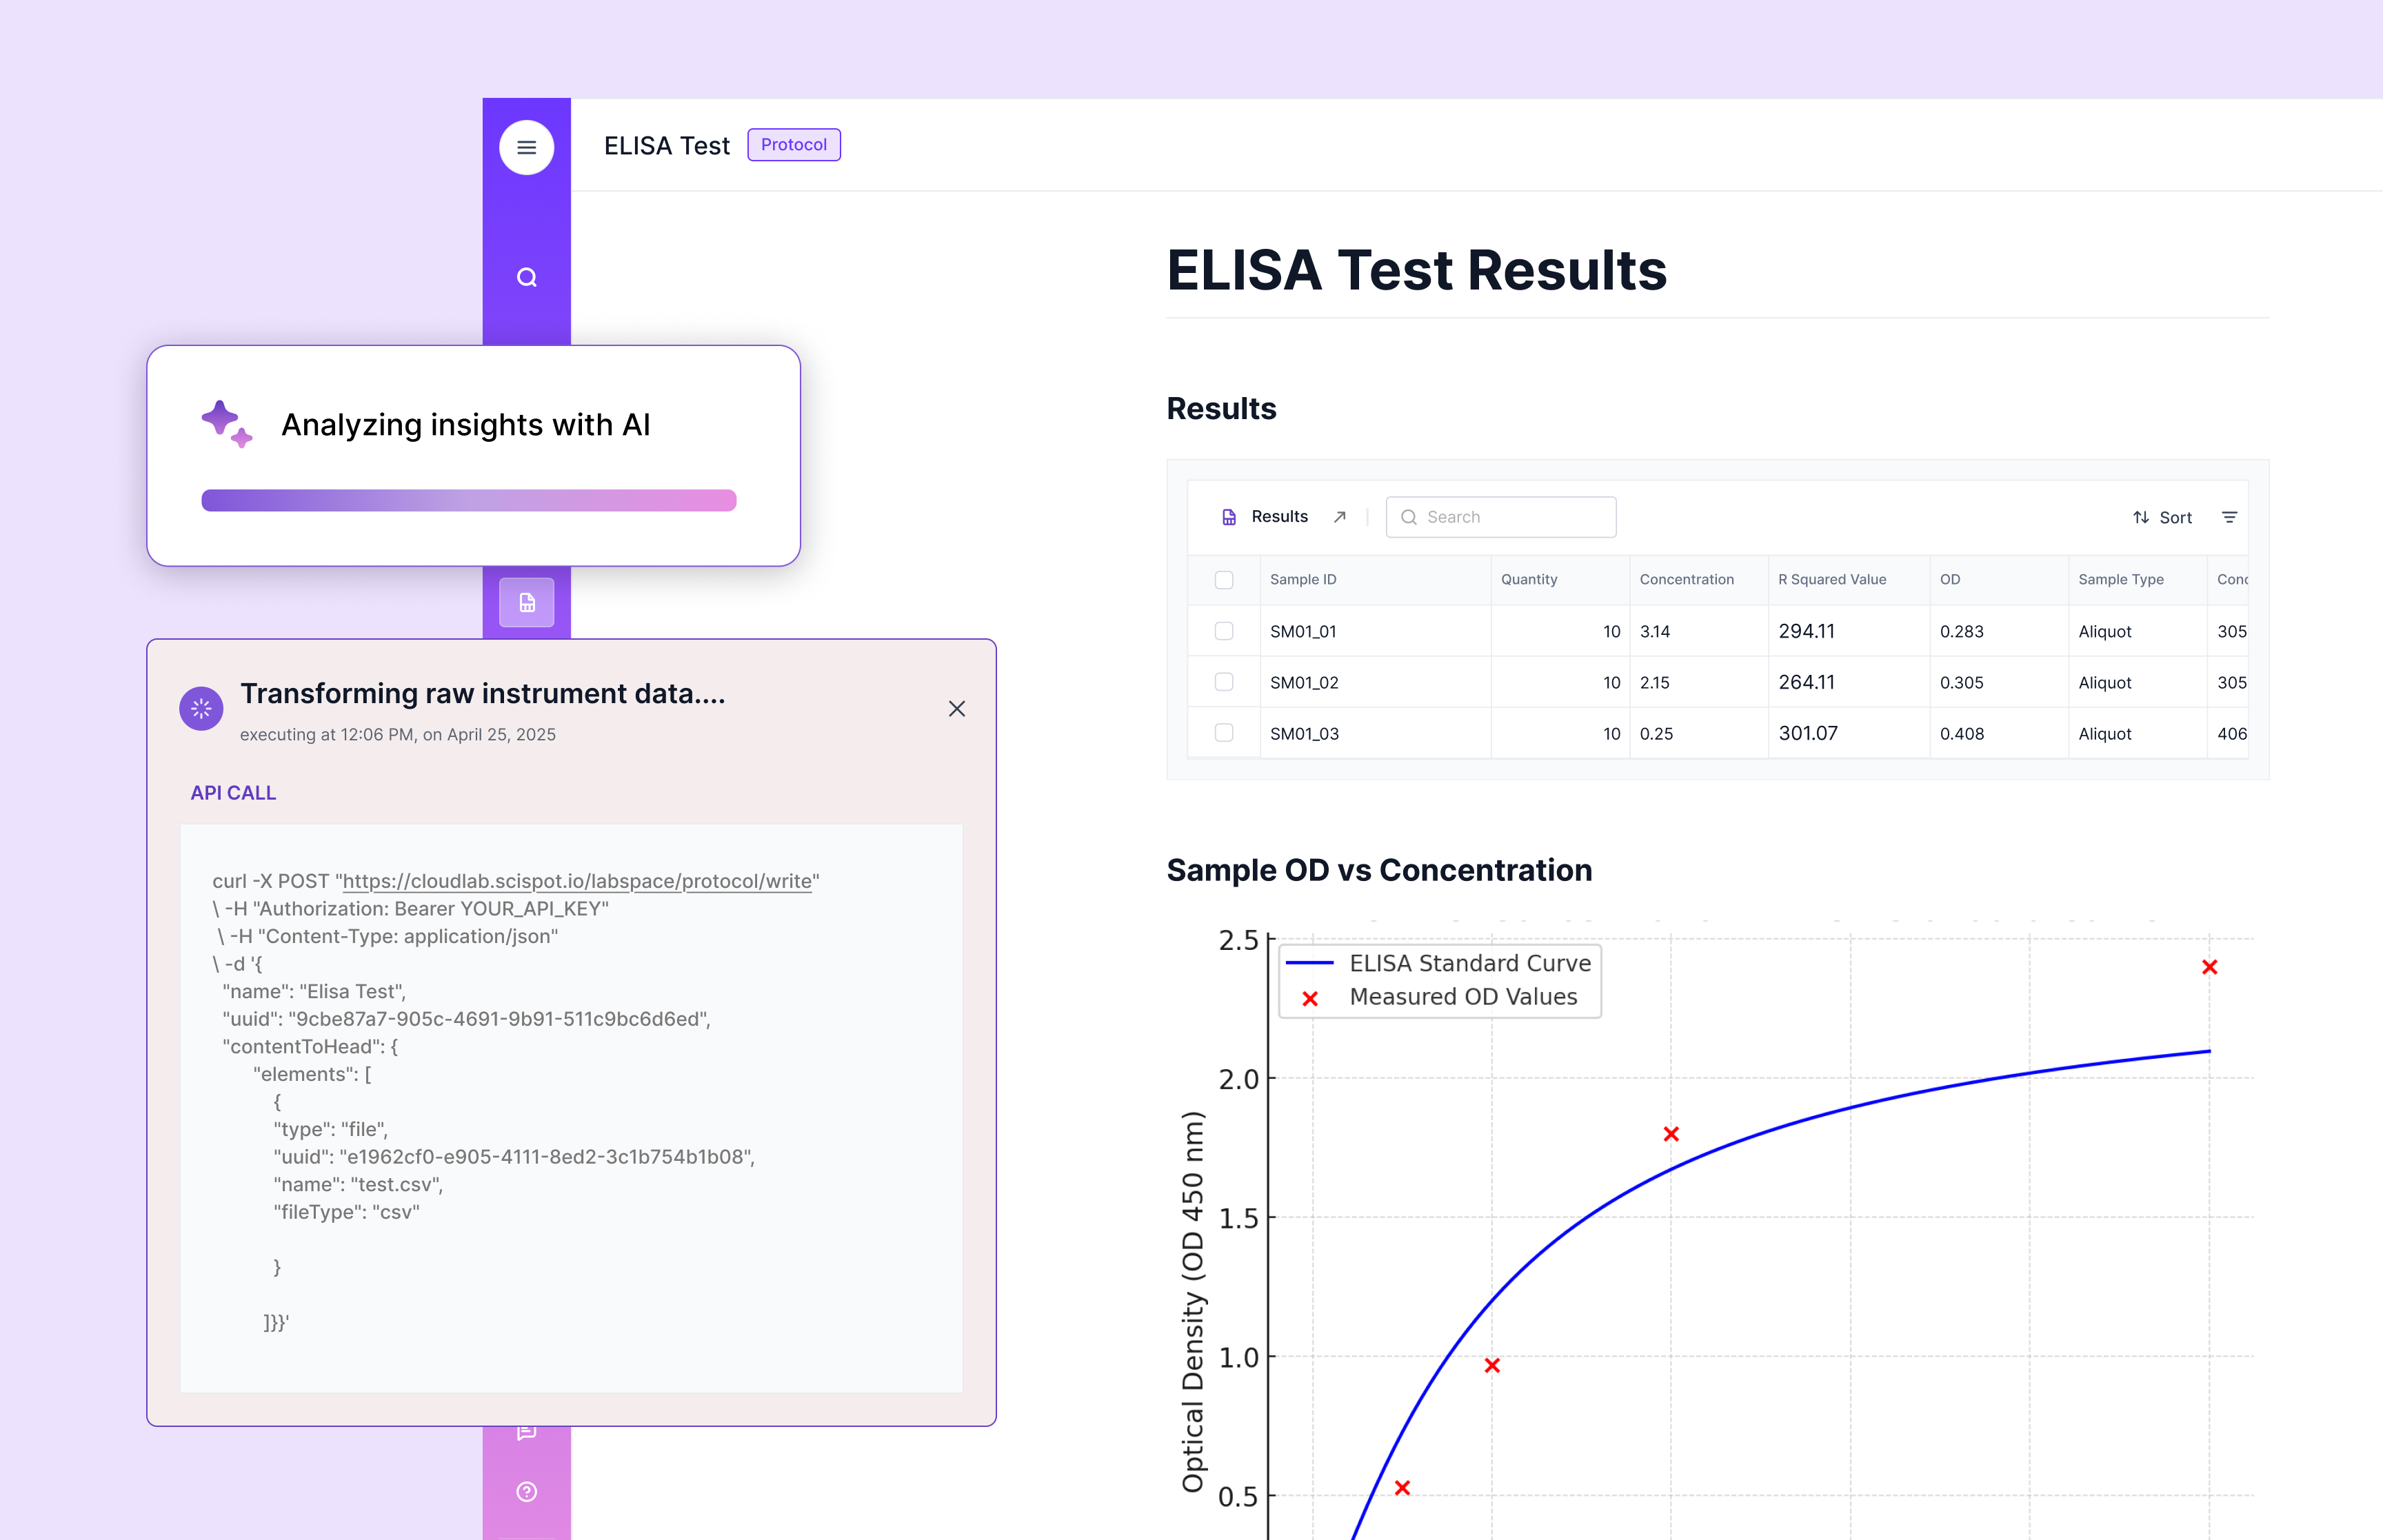
Scispot’s approach: typed capture and lineage link into a graph, while allowing raw data to flow into data lakes behind the scenes. You get queries like “trace this feature back to the raw file” or “show drift vs lot Y across cohorts” in seconds, not days.
How Labs Use This Today
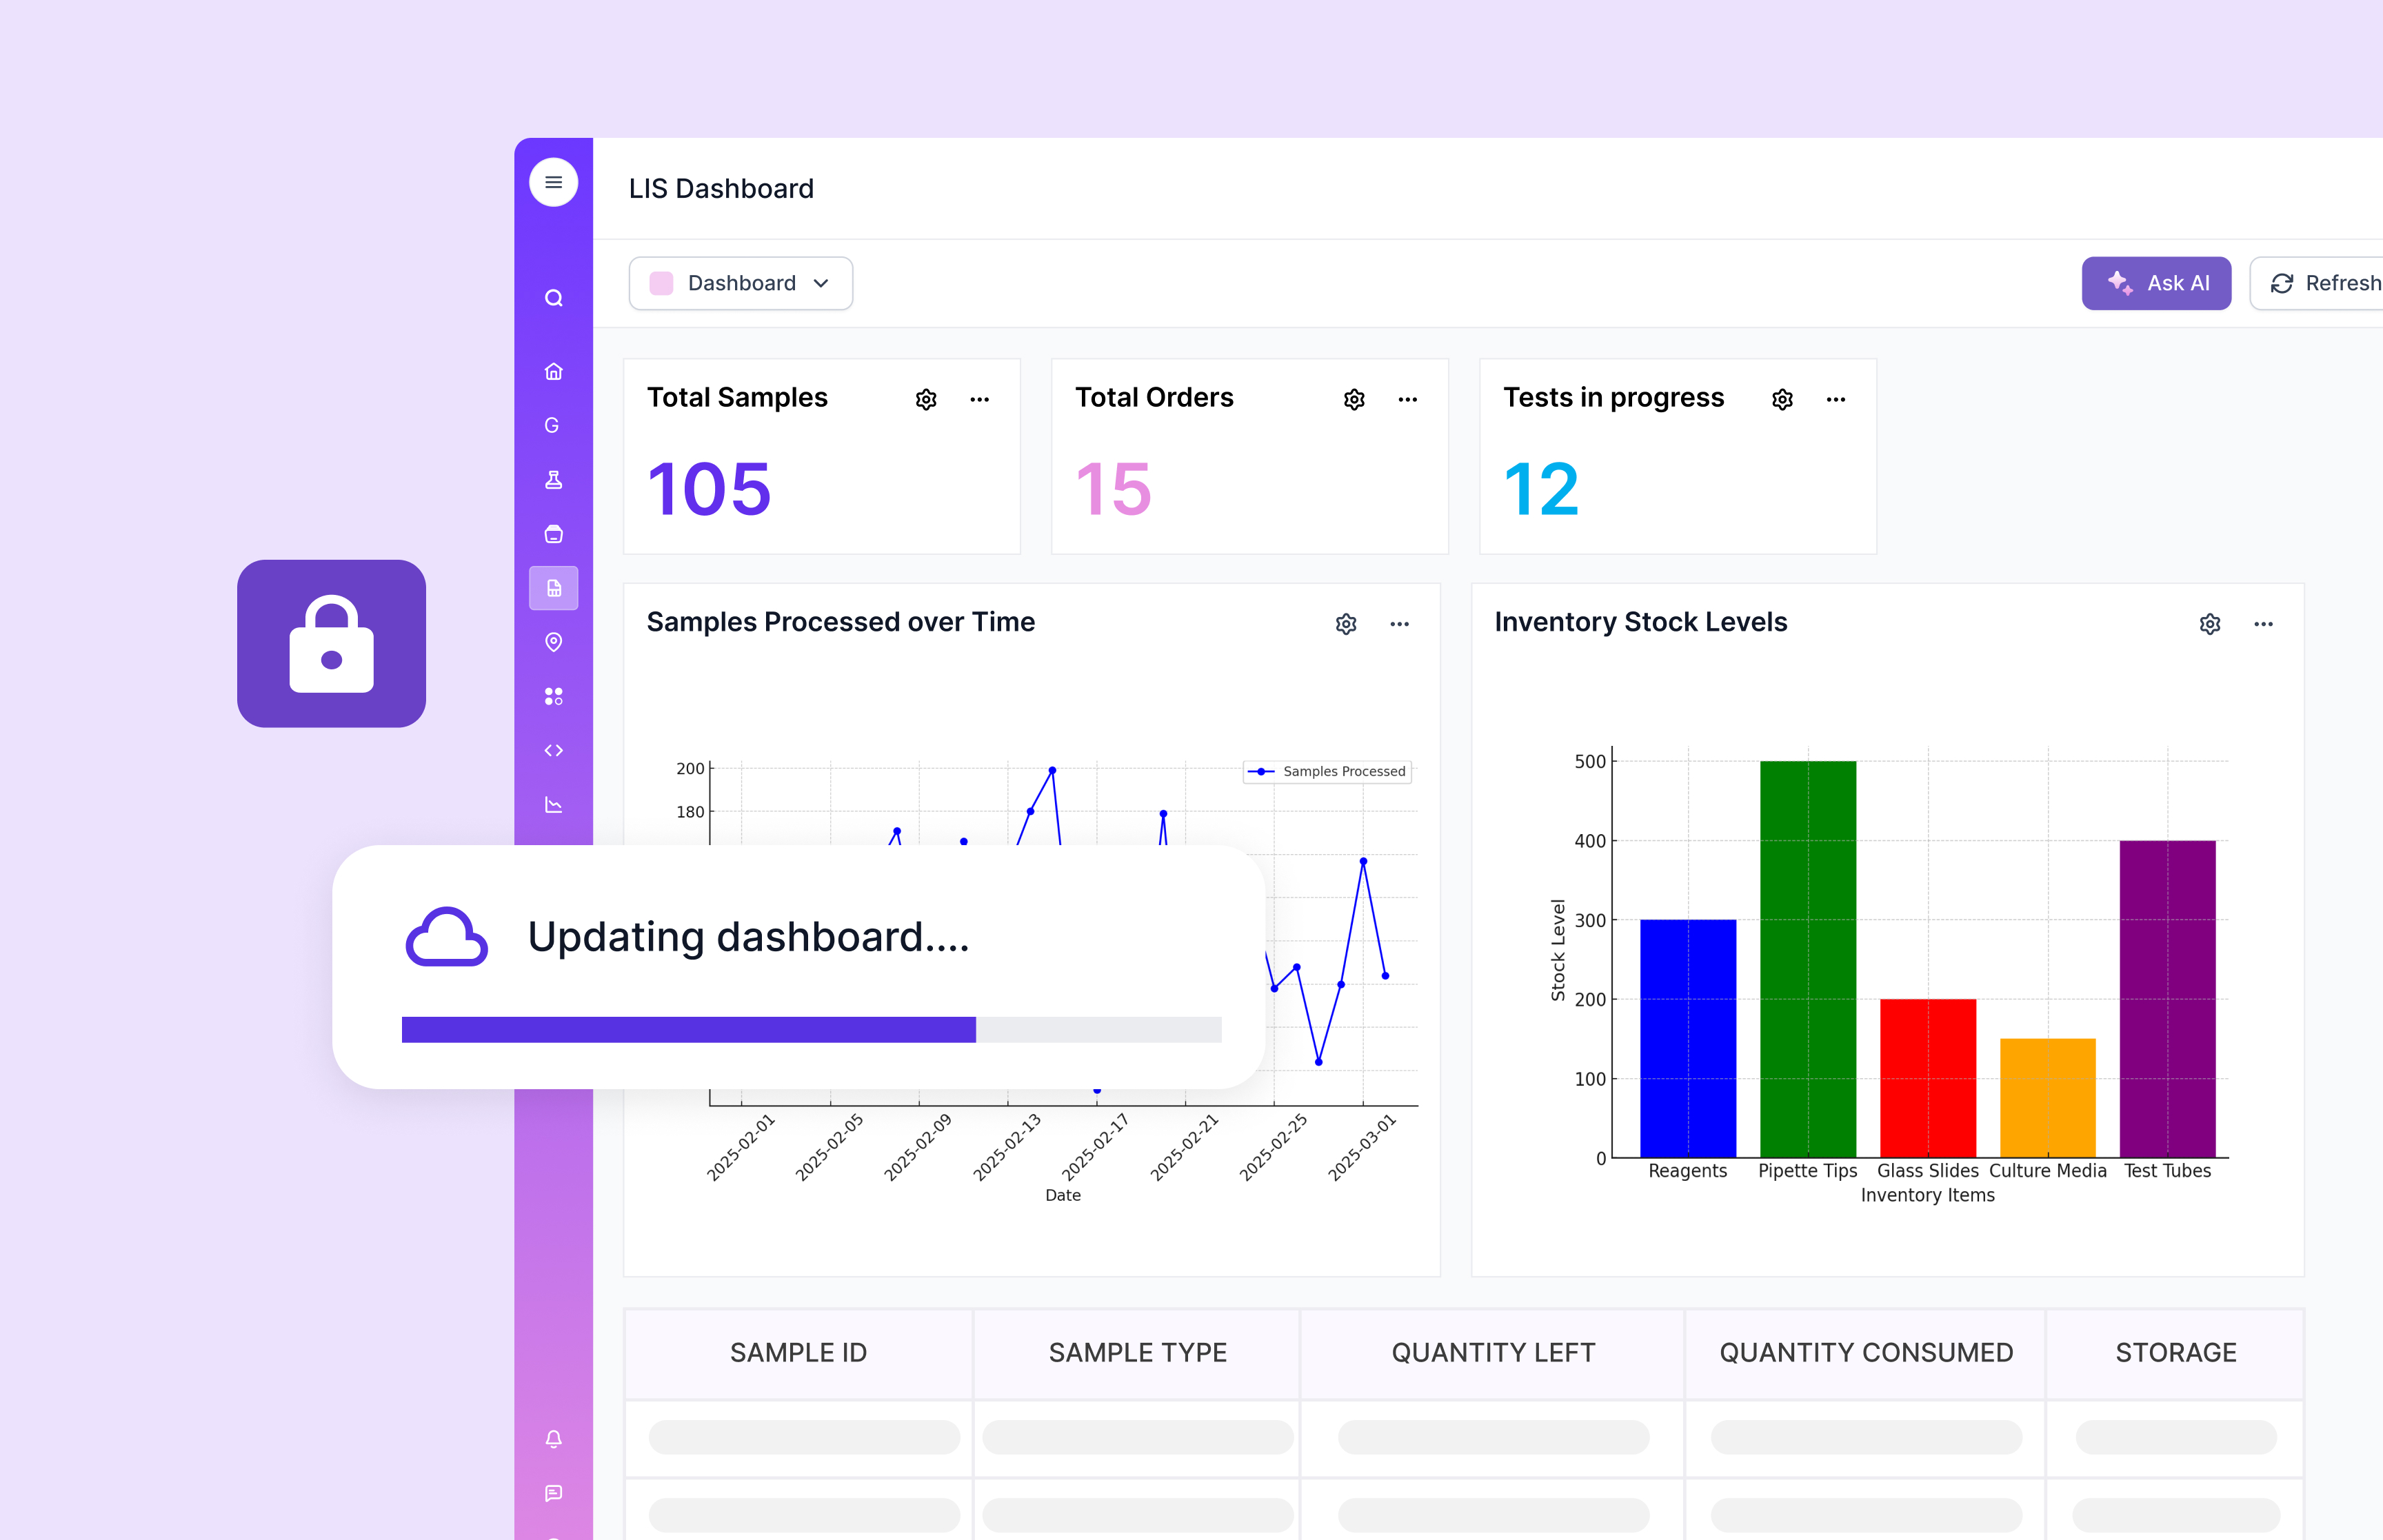
Labs might start with a simple question: “Which runs used instrument X in the past month where QC failed?” With the hybrid model, you can traverse sample‑run‑instrument relationships. Then you add “and show me the raw image files and metadata for those runs” — the link back to the lake makes that possible. As you scale, you build dashboards that span entities, listen for anomalies, feed ML pipelines, integrate CRO/CMO data, and trace lineage globally. The graph gives agility. The lake gives scale. And because you built the entity model once (typed labsheets, etc), it grows gracefully.
Why It’s A Game‑Changer
In a world where labs generate more data than ever, storage is cheap—but insight is pricey. A table‑only model hits limitations. You incur latency, you lose traceability, you bury questions in joins. The hybrid graph + lake lets you store everything, query relationships deeply, and scale elegantly. It’s the difference between “we’ve got the data somewhere” and “we understand the data so we can act on it”. When you bring in the right platform (Scispot), you avoid building your own graph infrastructure from scratch; you inherit the entity model, integration, lineage, and queries.
Conclusion
The future of lab data isn’t just big, it’s connected. A graph gives you the structure of relationships; a lake gives you the breadth of raw assets. Combine them with a platform built for labs and you unlock insight, speed, and scale. With Scispot, you’re not building the foundation next year; you’re stepping onto it now.